See projected spending by category, year by year
Overview
You can see your projected reserve spending by category for each year on the "Anticipated Expenditures" report and on the "Forecast Project Spend" report. The "Anticipated Expenditures" report shows one property's projected replacements year by year, and you can narrow it to one or more categories. The "Forecast Project Spend" report in "Portfolio Analytics" totals projected spending by category for each year across the properties you choose, and exports those totals as a table with one column per year.
Use the "Anticipated Expenditures" report to review one category in detail. Use "Forecast Project Spend" to see every category side by side, year by year.
Setup
You need at least view access to the "Reports" module to open the "Anticipated Expenditures" report.
You need at least view access to "Portfolio Analytics" to open "Forecast Project Spend". By default, Account Admin has edit access, and CFO and Finance Manager have view access. If "PORTFOLIO" is not shown in the top navigation, ask your Account Admin about your role's access. If "Portfolio Analytics Unavailable" is shown, contact SmartProperty.
To create a property group, you need edit access to "Portfolio Analytics".
How-to
Review one category on the Anticipated Expenditures report
Select "Reports" in the left navigation. This opens the "Reports" page.
Select the "Components Analysis" tab, then select "Anticipated Expenditures". This opens a chart of projected expenditures by year above a table of components grouped by the year each is expected to be replaced.
Select "Filters". This opens the filter panel.
Under "By Category", select one or more categories. The chart and table update to show only components in those categories.
Your filters save automatically for this property. The same filters apply when you open other reports for this property that offer "Filters", until you change them or select "Reset All Filters".
Select "Export to Excel" to download the filtered report as a spreadsheet, or select "View As PDF" to download a PDF version. Both use your current filters.
See every category year by year with Forecast Project Spend
Select "PORTFOLIO" in the top navigation, then select "Reports" in the left navigation. This opens the "Portfolio Reports" page.
Select "Forecast Project Spend". This opens a chart of projected spending by year, followed by a "Details" section.
Under "Property Group", choose the properties to include. "All" includes every property in your Portfolio that has components.
Choose "3 Years", "5 years", or "10 years". The chart, the "Details" section, and the export cover that many years. The report opens at 5 years and starts with the current calendar year.
The "Details" section opens grouped by "Year". Under "Group By", select "Category". Each row shows a category and its projected total for the period. Expand a row to see that category's spending for each year, split by property.
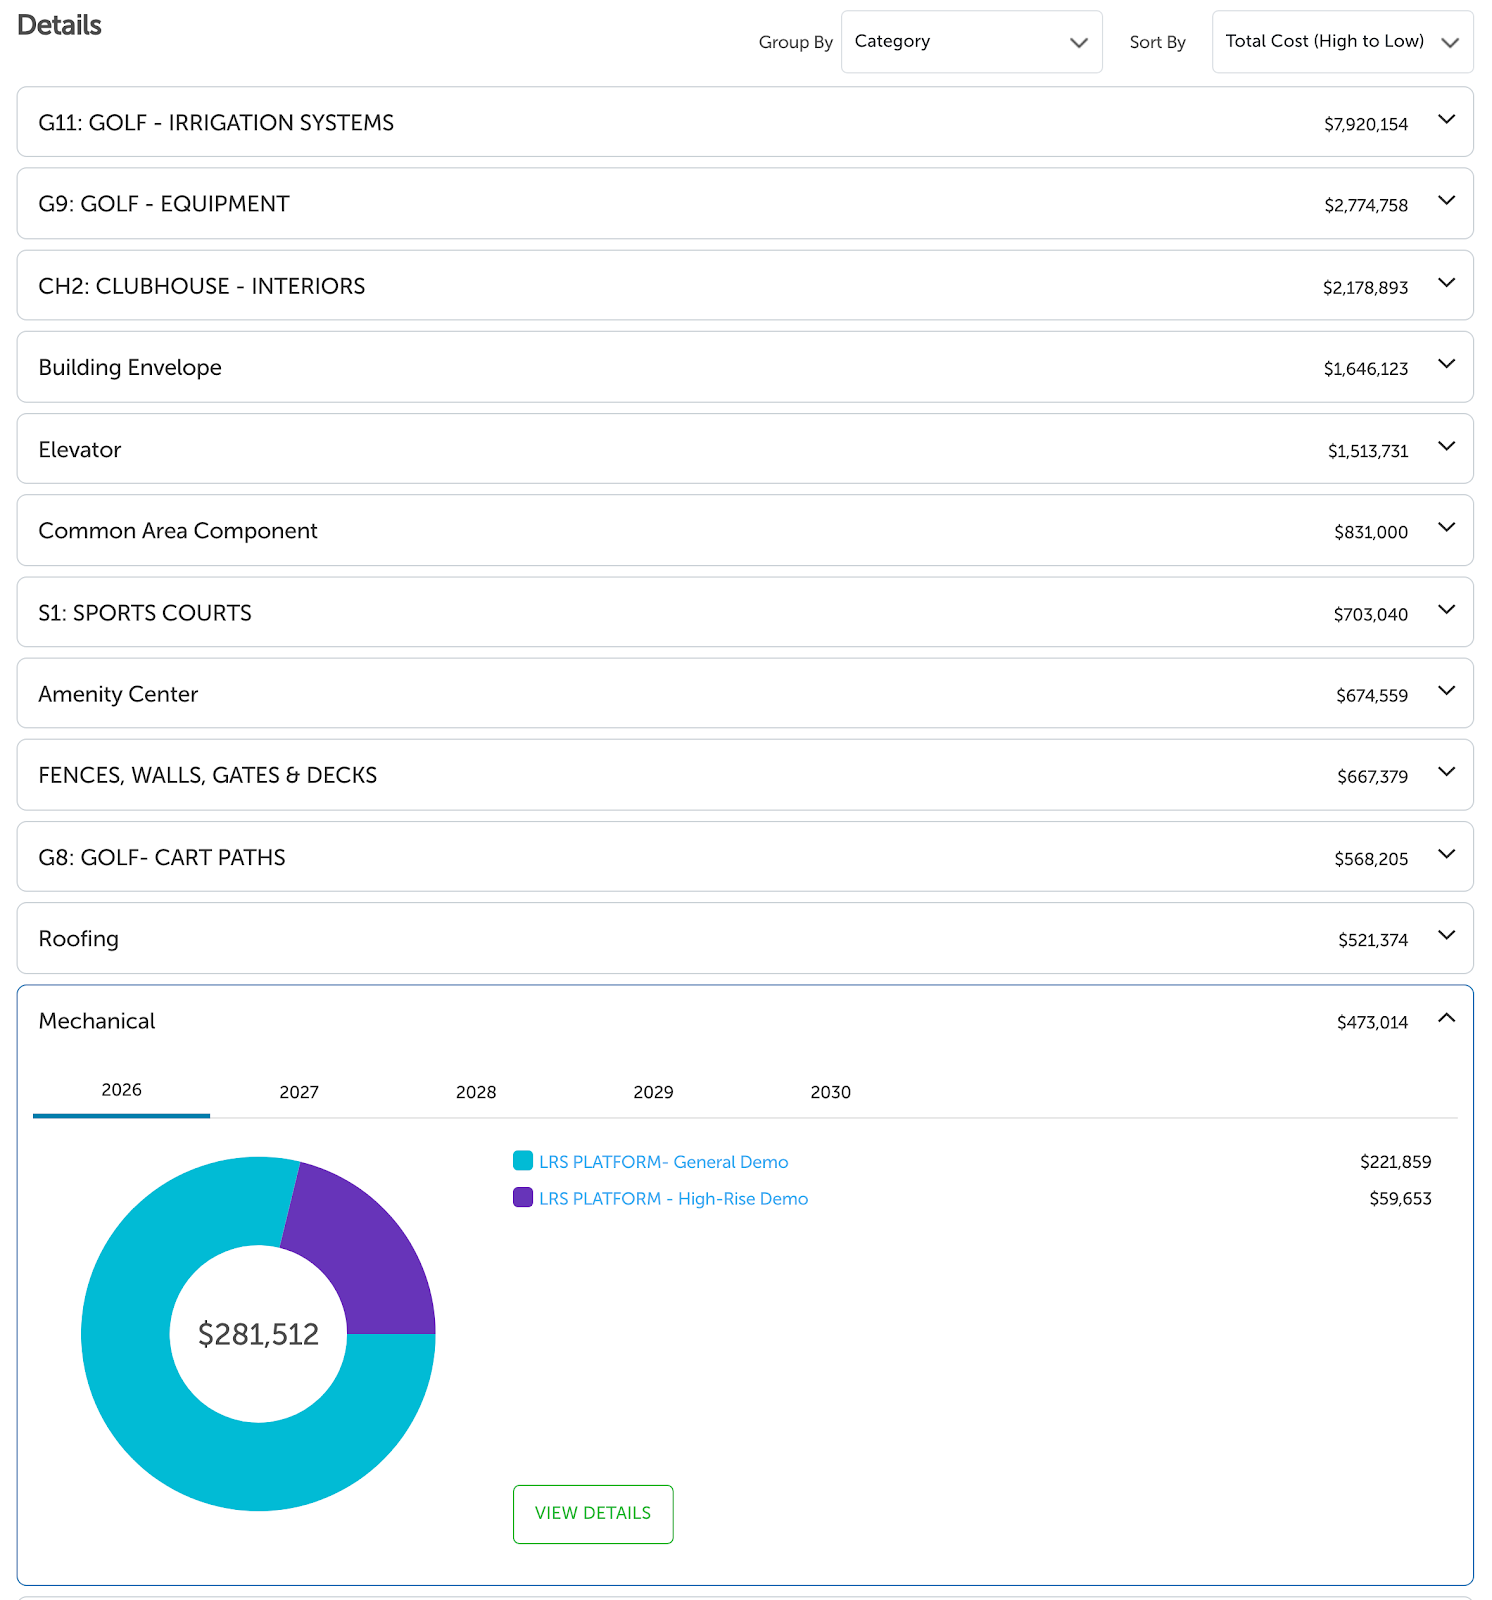
Select "Export to Excel". This downloads a spreadsheet. The "Summary" sheet lists each property and each category, with one column for each year. The spreadsheet also has one sheet for each year, listing each property's components with their projected cost, and one sheet for each category, showing each property's total for each year.
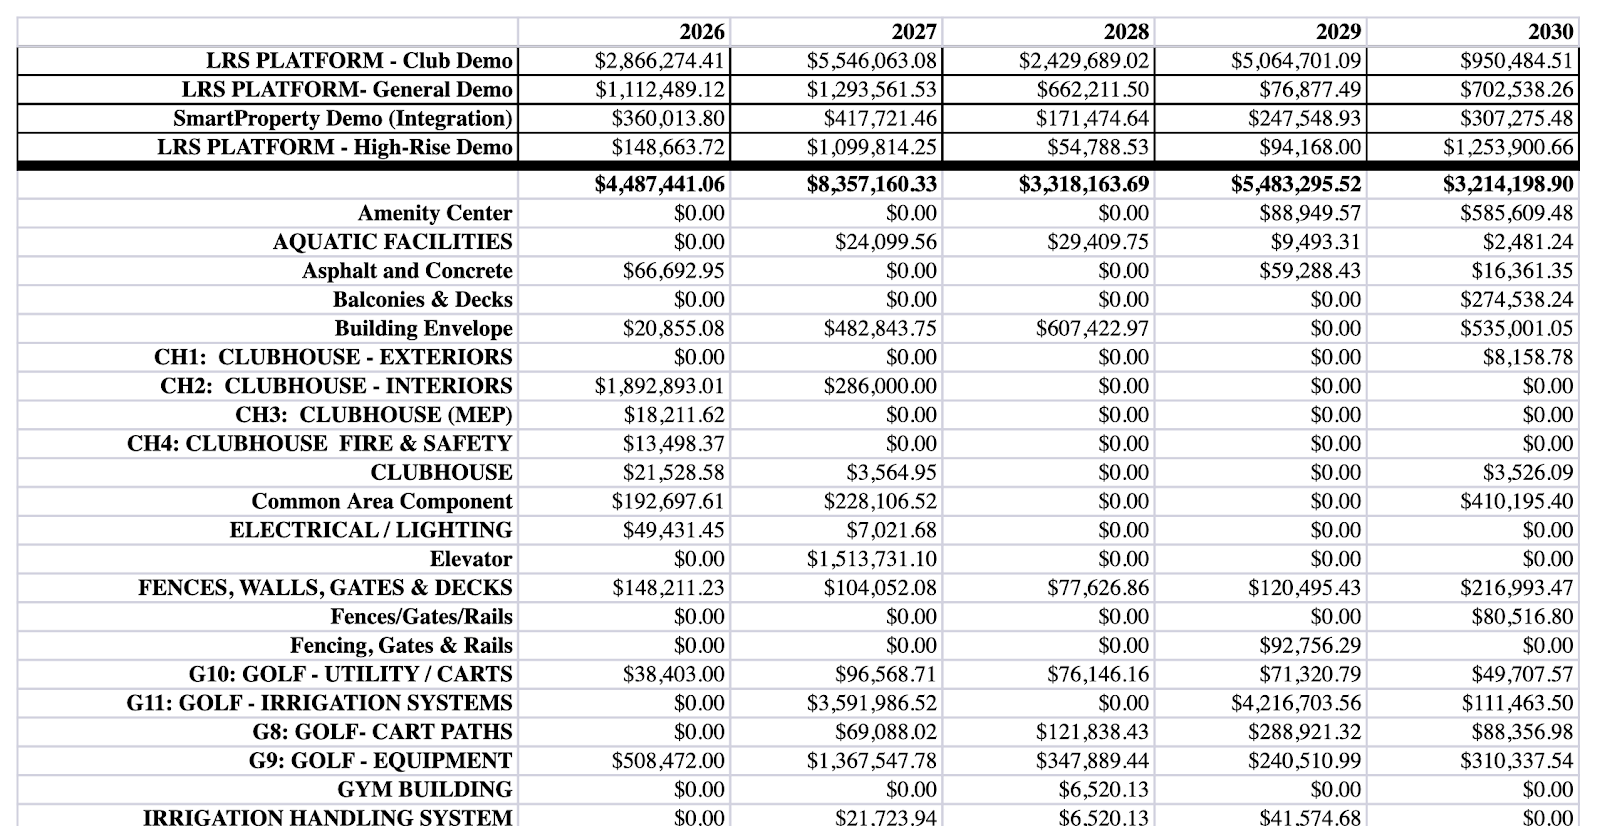
See one property's categories year by year
Under "Group By" in the "Details" section, select "Property". Expand the property's row. Each year tab shows that property's spending split by category.
To export one property's categories year by year, create a property group that contains only that property, select the group under "Property Group", then select "Export to Excel".
Create a property group for one property
Select "PORTFOLIO" in the top navigation, then select "Settings". This opens "Portfolio Settings".
Select the "Property Groups" tab, then select "New Property Group". This opens "Create Property Group".
Choose "List Group", enter a "Property Group Name", and add the one property under "Properties".
Select "SAVE". The group is now available under "Property Group" on "Forecast Project Spend".
Reference
What the figures show
Both reports show projected replacement costs, increased for inflation to the year each replacement is expected. The "Anticipated Expenditures" report also shows each component's current replacement cost in today's dollars.
"Forecast Project Spend" uses each property's current fiscal year.
"Forecast Project Spend" updates overnight. A change you make to a property's components appears in the report the next day. If a figure is still out of date after that, contact SmartProperty.