Read the Reserve Allocation Report
Overview
The "Reserve Allocation Report" shows how each funding plan's annual reserve contribution divides across your components and categories. Use the report to answer where this year's contribution goes, for example how much of it funds Roofing compared with Painting. The report places every funding plan for the fiscal year side by side, one column per plan.
Setup
You need at least view access to the "Reports" module. Without it, "Reports" does not appear in your left navigation.
The report shows every funding plan created for the fiscal year selected for your property. To see a plan in the report, create the plan for that fiscal year first. See Create a funding plan.
When no funding plans exist for the fiscal year, the report lists your components with no plan columns.
How-to
Open the report
Select "Reports" in the left navigation. This opens the "Reports" page.
Select the "Summary Reports" tab.
Select "Reserve Allocation Report". This opens the report for the fiscal year selected for your property.
Read the table
The table groups reserve components by category. Non-reserve components are not included. Categories and the components within them are listed alphabetically.
Each component row shows the component name, its "GL Code", and its share of each plan's "Annual Reserve Contribution".
Each category ends with a "Total" row. The "Total" row is the category's share of each plan's contribution.
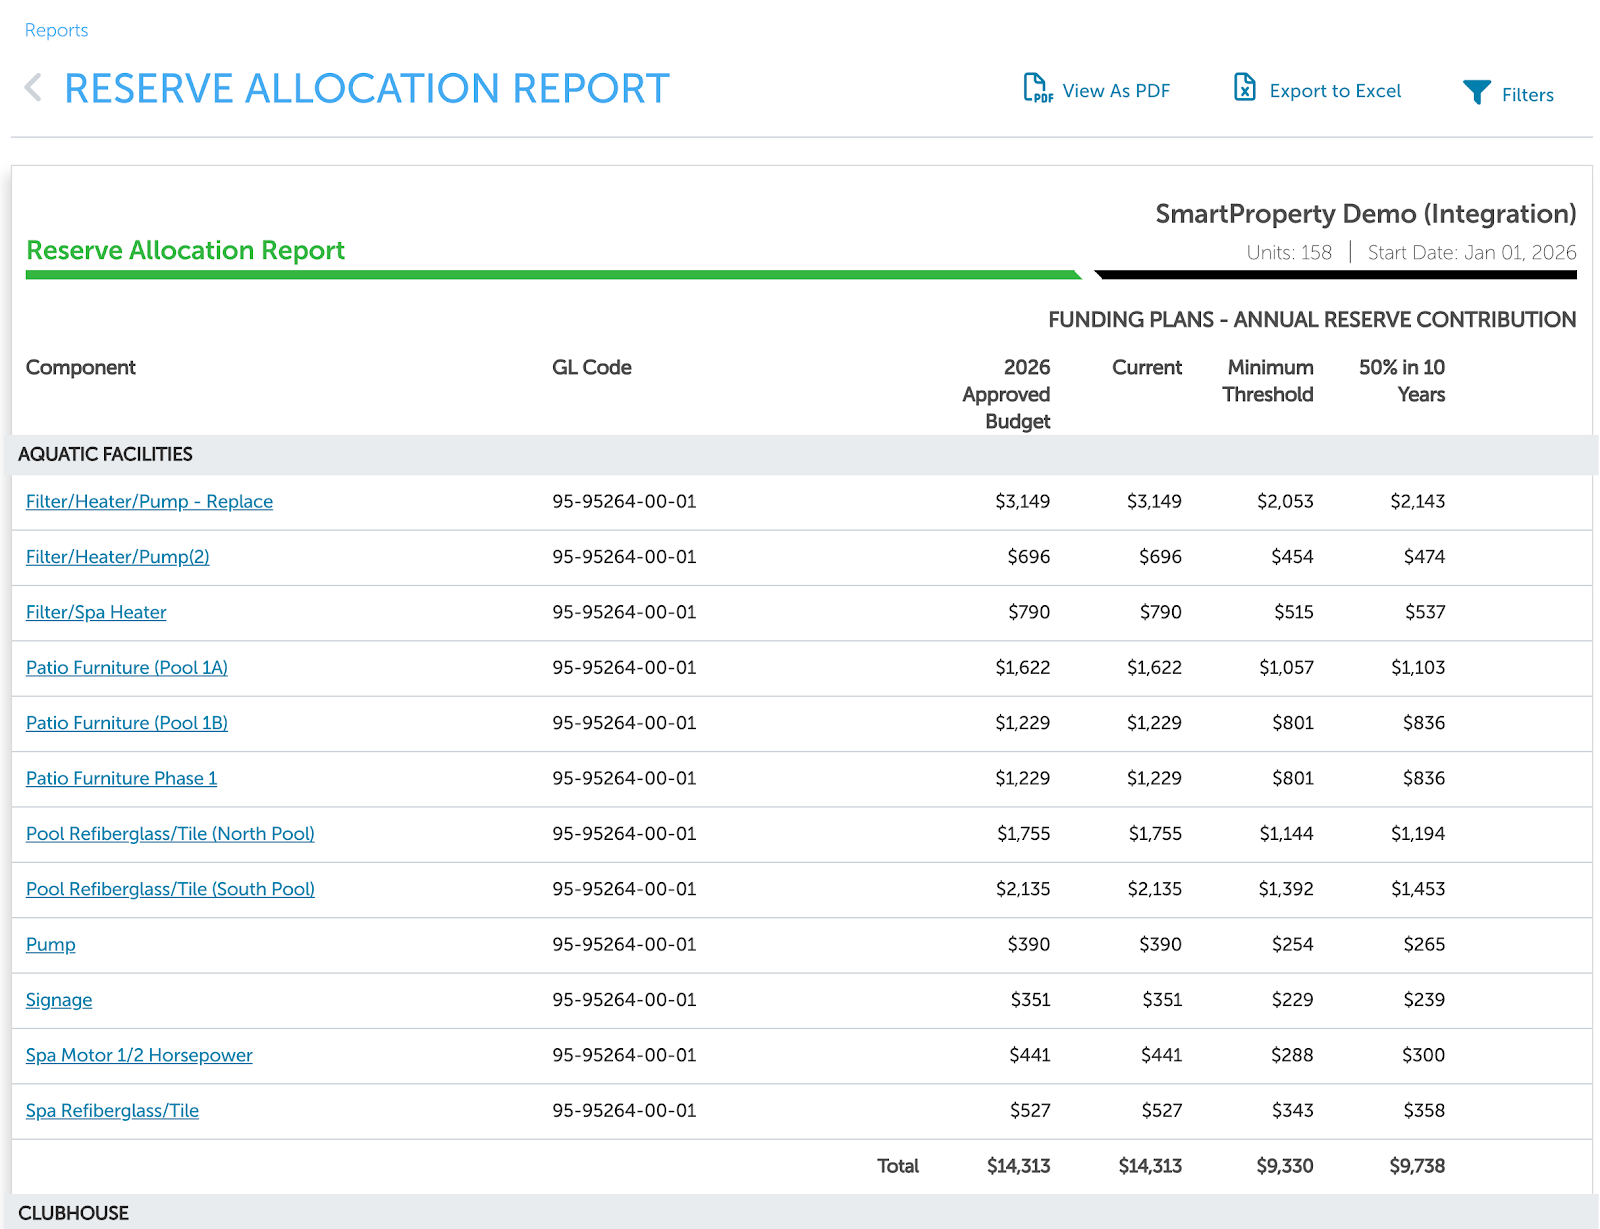
The "Totals" row at the bottom of the table is each plan's full "Annual Reserve Contribution" for the fiscal year.
With access to "Components", select a component name to open that component's details.
Compare categories or groups of categories
Read the "Total" row for each category to see how a plan's contribution divides across categories.
To total several categories together, export the report to Excel and add their "Total" rows.
Narrow the report with filters
Select "Filters". This opens the filter panel.
Choose one or more filters, such as "By Category", "By Location", or "By Source". The table updates to show only the matching components.
Filters change the amounts, not just the rows. The report divides each plan's full contribution across only the components that match your filters. A filtered report therefore shows the same or larger amounts per component than the unfiltered report. To see a category's share of the full contribution, read its Total row on the unfiltered report.
Filters you set on other reports for this property also apply here, including tag filters set on the "Anticipated Expenditures" report. If amounts differ from what you expect, open the Anticipated Expenditures report and select "Reset All Filters".
Export the report
Select "View As PDF". This downloads a PDF version of the report.
Select "Export to Excel" instead to download the report as a spreadsheet. The spreadsheet has one sheet with the full report, followed by one sheet for each category.
Both the PDF and the spreadsheet use your current filters.
Reference
How the contribution is divided
Each component receives a share of the plan's Annual Reserve Contribution in proportion to its annual funding need. A component's annual funding need is its current replacement cost divided by its useful life.
For example, a component that costs $100,000 with a 20 year useful life has an annual funding need of $5,000. A component that costs $30,000 with a 10 year useful life has an annual funding need of $3,000. With only these two components, the first receives five eighths of each plan's contribution and the second receives three eighths.
The contribution used for each plan is the plan's contribution for its first year. The first year is the fiscal year shown on the report.
Where else the table appears
The "Reserve Analysis Report" includes the same table in its "Reserve Allocation" section, without your filters. With edit access to "Reports", turn the section on or off under "Sections to include in the report" in "Edit Report Settings".